August 2026 precious metals roundup
Written by Luke Heritage
3rd September, 2026
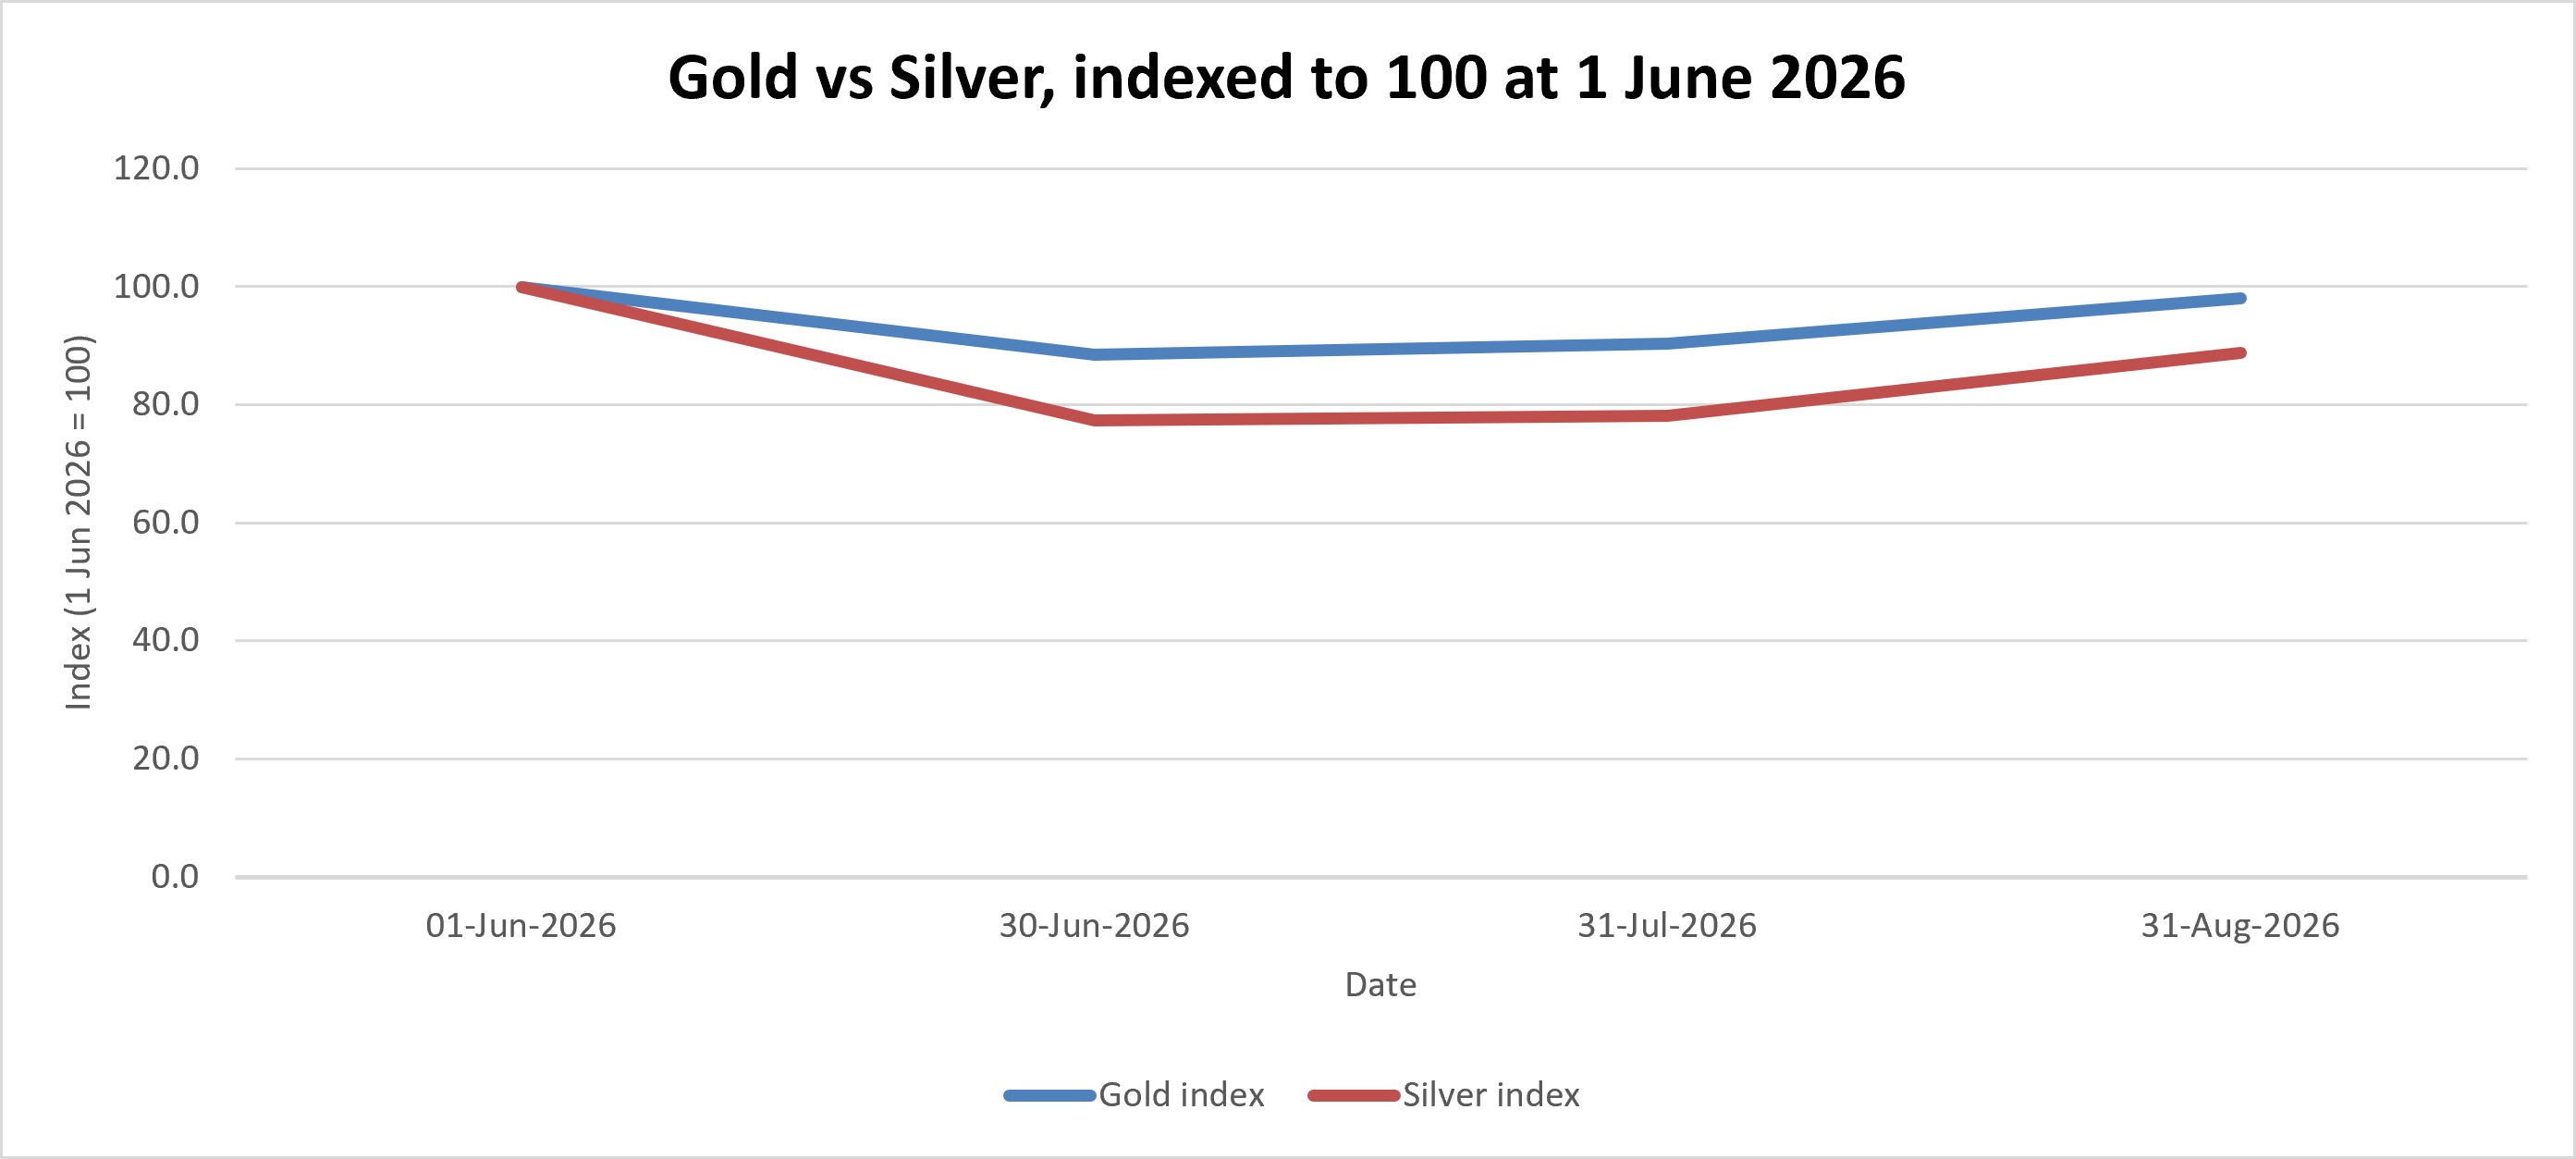
For August, gold opened around $4074 an ounce and closed at approximately $4451 an ounce at the end of the month, gaining around 9.3%, the strongest month since the spring. Silver did considerably better, up roughly 15.2%, opening at $58.26 and finally closing at $67.11, the first month since May that silver has meaningfully outpaced gold, compressing the ratio to 66.3. This has been a genuine reversal after two straight months of gold moving more than silver. During the month, gold hit a year high at $4679.50 before both metals pulled back slightly after a hawkish speech from Fed Chair Kevin Warsh.
What was moving gold?
Three major drivers of gold’s movement were: Firstly, U.S. inflation data released earlier this month was slightly lower than anticipated, which reduced expectations of a near-term Federal Reserve rate hike. Lower than expected real rates of interest are generally supportive of gold, and it rallied from just above $4,000 to over $4,600 in the third week of August, a rally of approximately 14% in three weeks. Secondly, the World Gold Council’s second-quarter 2026 data (central banks purchased a record 288.9 tons of gold) was still being discussed throughout the market in August as the “official sector” story grew stronger; both central-bank and other physical demand were estimated to contribute roughly 55% of the rally. Thirdly, the Iran conflict, which the Bank of England has been tracking since it started on 28 February, reached its six-month milestone in late August, and geopolitical risk premium remained high throughout the month. This affected gold in both ways at the very end of the month: gold rallied on news that the U.S. had attacked Iranian rocket launchers near the Strait of Hormuz on approximately 28-29 August; however, Fed Chairman Kevin Warsh’s hawkish keynote speech at Jackson Hole on 28 August, his first as Chairman, warning that "we have work to do" on inflation and increasing anticipation of a possible hike, resulted in a sharp reversal. Gold declined from $4,595 on 29 August to approximately $4,45 on 31 August, a decline of more than 3% in two days, as rate-hike concerns temporarily surpassed the haven appeal.
Although only partial, demand-side data for August indicates the same trend as the price action. Weekly fund data revealed that SPDR Gold Shares (GLD), the largest single-gold ETF, attracted $1.19 billion on a single day around 25 August and $3.38 billion during the week ending 21 August alone, while total global gold ETF inflows were estimated to be approximately $5.5 billion for August, a third straight month of net purchases following June's substantial outflow and July's tentative recovery, indicative of a market where investment demand was driving up the price rather than resisting it, contrary to June's pattern. Two honest caveats: The World Gold Council's official monthly ETF report for August was not published at the time of writing (it usually comes out in the first week of the subsequent month); therefore, the $5.5 billion aggregate inflow reported above is based on secondary sources rather than WGC-verified data and should be verified after their report is released. Also, Q3 central bank buying statistics will not be published until the WGC releases their next quarterly Gold Demand Trends report in November; thus, there are no new official-sector data points available for August specifically. While nothing in the price action suggests a reversal of the record pace of Q2 buying (289 tons), this is an inference and not a confirmed fact yet. Similarly, mine supply and recycling data are only published on a quarterly basis. Therefore, the Q2 readings (production +2% year-over-year, recycling -6% year-over-year) represent the most current official statistics.
What was moving silver?
Silver had its best performance of the last two quarters. It went from $55.50/oz in July to $68-$69.7/oz in August. Gold had a 9% return while silver returned about 15%. This is the sixth consecutive year that silver will experience a supply shortage. The demand for silver is continuing to grow and expand into new areas such as AI and data centres in addition to the traditional solar and EV markets. Industrial usage of silver made up about 59% of the total amount of silver consumed in 2025, and this number appears to be growing, not decreasing. The majority of the world's supply of silver comes from base metal mining operations, so they cannot simply increase their production to keep pace with demand. When you have a significant increase in demand for something that is in limited supply due to structural reasons, you often see very large increases in prices. Silver lost approximately 4.2% on August 30th along with gold's decline but remained the top-performing metal for the month.
To provide a deeper look at demand and supply trends: central bank involvement in the silver market was virtually non-existent in August, as it has been throughout the entire year. The vast majority of the demand for silver is driven by investment and industrial uses. Several media outlets have reported that silver ETFs experienced large inflows in August after years of experiencing net outflows. For example, the iShares Silver Trust (SLV), the largest silver ETF, received substantial weekly inflows during the month of August which supports the strong price action discussed previously. While the actual weekly dollar amounts may vary slightly due to inconsistencies in how different organisations report ETF flow data for silver compared to the World Gold Council's monthly gold report, the fact remains that SLV experienced large weekly inflows during August. Furthermore, media outlets continued to report that there is an increasing number of end-use applications for silver. Specifically, AI and data centre construction are now being added to solar, EVs, and semiconductors as major drivers of industrial silver consumption. According to the Silver Institute, industrial consumption accounts for approximately 59-61% of the total yearly demand for silver. Meanwhile, the supply of silver continues to contract and is expected to result in a sixth consecutive annual deficit of 46.3 million ounces for 2026. The combination of expanding demand and contracting supply is clearly providing the structural basis for why silver performed so much better than gold in August.
What is there to look out for next month?
The next Bank of England interest rate decision on 17 September is likely to create additional calendar conflicts during September. Although there appears to be very little possibility of a rate change at this point in time, this is the first MPC meeting after the hawkish 29 July vote. Therefore, it is important to pay attention to how the voting split unfolds. On the other hand, comments made by Fed Chair Warsh at Jackson Hole suggest that there may be a larger possibility of a hawkish surprise at the upcoming September FOMC meeting. A hawkish surprise at the September FOMC meeting would represent the most significant threat to the continued upward trajectory of gold prices without disruption. A true U.S. interest rate increase would represent the first opportunity to truly assess if a majority of the August price increase was driven by real market dynamics or by expectations of rate increases. The Iran conflict has been going on for six months, and it seems as if there is no end in sight. As such, any additional escalation of the conflict (or credible de-escalation) will likely lead to rapid fluctuations in both gold and silver prices. Finally, watch for the World Gold Council's next release of data related to third-quarter central bank gold purchases. If the official sector continued to purchase gold during a time when gold prices rose rather than fell, that will represent a strong positive development in support of the long-term structural case for gold.
My outlook
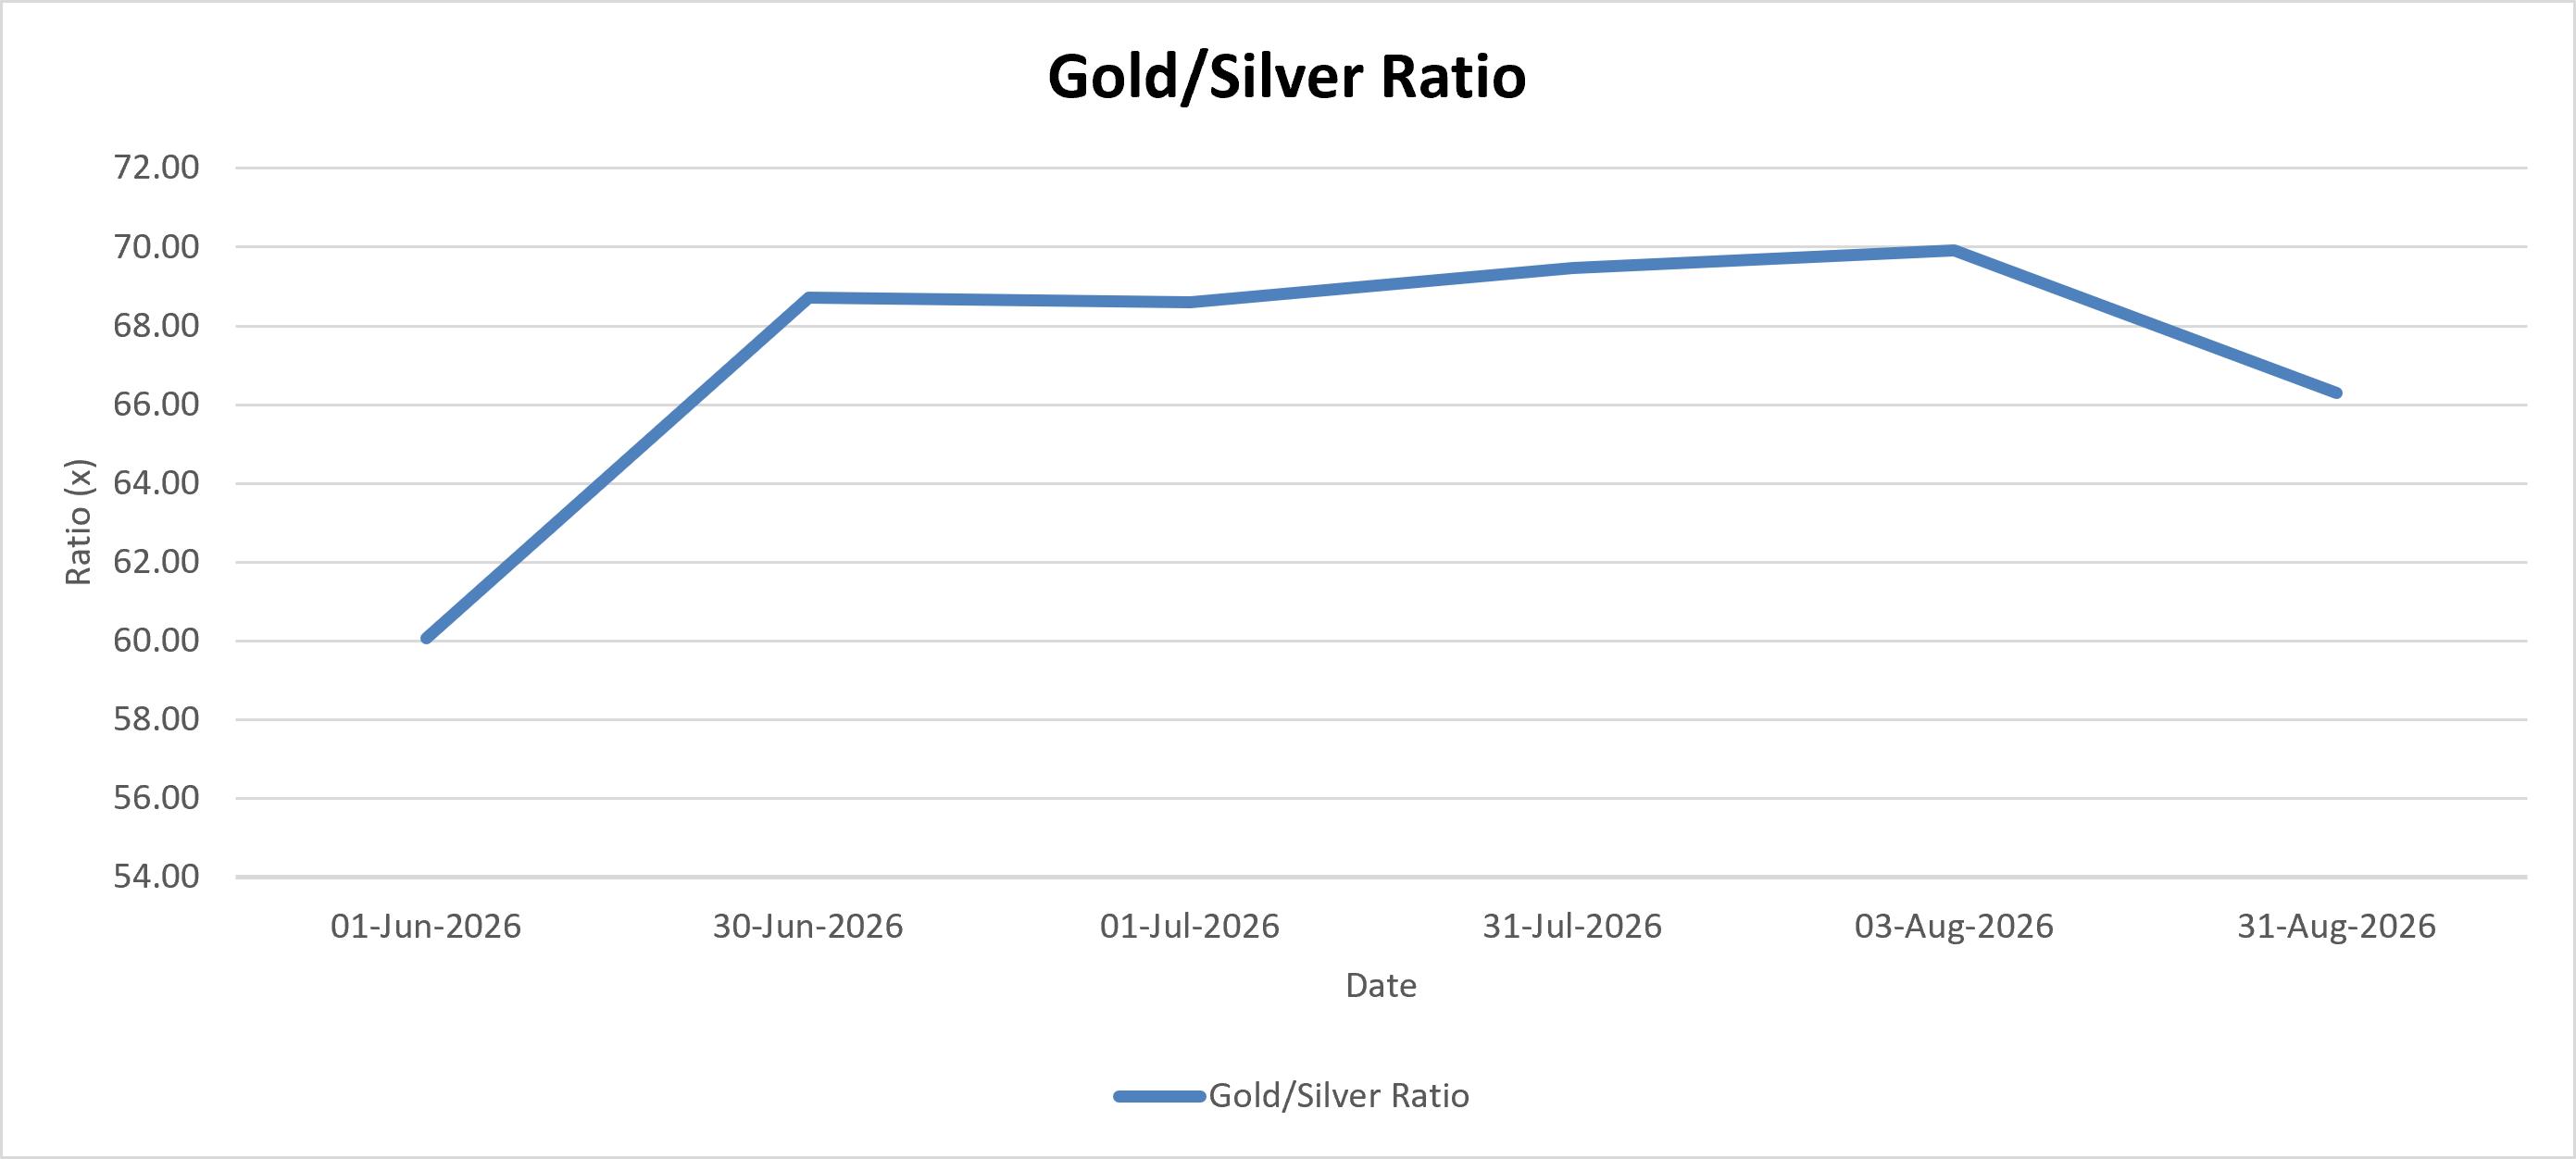
As you remember from my previous two articles, I had a theory that both gold and silver are underpriced today, particularly silver due to an extremely high gold-silver ratio, continued structural deficits in silver production, and central bank purchases of gold at approximately twice their rate before 2022. Did August provide support for this theory? In my opinion, August is the first time I can confidently say "yes" to this question. Not only did prices increase during August, but the gold-silver ratio also began to correct itself by moving from approximately 69.5 (just shy of 70) down to approximately 66 by the end of August. This was exactly what I expected to see happen; specifically, I believed that silver would catch up to gold instead of gold continuing to pull away from silver.
In addition, the supply deficit argument for silver became even more compelling during August, as there were reports of a new source of demand for silver (AI and data centre construction) in addition to the established demand sources (solar power, EVs, semiconductors). None of these new sources of demand will do anything to increase the supply of silver, as most of it is sourced as a byproduct. Finally, the central bank purchase component of my gold theory is still very much alive. Nothing in the August report indicated that official sector purchasing of gold has decreased. To be perfectly honest about how my thoughts have evolved since I first wrote these three articles: While the gold-silver ratio dropped from 69.5 in July to approximately 66 in August, I view that single-month drop as potentially being reversed next month if the near-term catalyst (an impending Fed rate hike) becomes more clearly defined. Therefore, I am treating August as the first real validation of my theory rather than proof that it is occurring. Before I declare that the ratio has "proven" that silver is catching up to gold, I would need to see the ratio continue to contract over the next one to two months and ideally move back into the low-mid 60s or lower.
Final comments
August was the best month for precious metals in over three months. For the first time since my thesis on precious metals was presented in the June edition of this publication, the gold-silver ratio did what I predicted it would do. There were several factors that helped drive gold to a new yearly high and silver to its best quarter-ending month: The U.S. Federal Reserve appeared to be backing off its aggressive rate-hiking policy; Central Banks purchased more gold than ever before; and Silver is experiencing a broadening of industrial uses. However, as quickly as gold and silver rose, they fell due to a hawkish Fed speech and conflict with Iran.
Sources
Benzinga "Gold ETF Leads Inflows as Mega-Cap ETFs Shed Billions"
Fortune "Current price of gold: August 31, 2026"
Federal Reserve Chairman Warsh's Jackson Hole keynote remarks, 28 August 2026
ETF Action "SPDR Gold Shares Leads Commodity Surge with $1.3 Billion Inflow"
mygoldcalc.com August 2026 gold price archive
PV magazine USA — "Silver prices rebound as AI, data centers add to industrial demand"
Silver Institute 2026 deficit forecast
Trading Economics gold price commodity page
World Gold Council Gold Demand Trends Q2 2026
Yahoo Finance / ETF.com "Silver prices today, Monday, August 31, 2026"