July 2026 precious metals roundup
Written by Luke Heritage
2nd August, 2026
July was a volatile month, acting as a slight net recovery for both metals, with gold opening at $4006.57 an ounce and gaining around 2.5% to $4106 an ounce, disguising a dip below $4000 which was hidden behind a strong late-month rally. Silver told a similar story, opening at $58.42 an ounce and closing at $59.10 an ounce, up 1.16% after ranging between the mid-50s and low 60s within the month. The gold and silver ratio ended the month at around 69.48, its highest for months, meaning although both metals saw a net gain, gold's gain slightly outpaced silver's, thus resulting in a stretched ratio.
What was moving gold?
July's gold story consists of two stories stitched together, with the first half of the month seeing gold trade heavily, dipping to an intraday eight-month low, almost 30% lower than the January all-time high, after Fed officials flagged the possibilities of rate hikes and US retail sales data came in strong, keeping the dollar stable. But in the second half of the month, Middle East tensions pushed Brent crude and UK gas higher, which reignited gold's safe-haven bid just as the Fed's 29th July meeting resulted in a hold of the rates. The combination of a de-escalation in immediate hostilities late in the month and the confirmation that the Fed was not going to hike allowed gold to hit a rally at months end to above $4100 an ounce.
The World Gold Council's Q2 2026 Gold Demand Trends report published 30th July added a structural tailwind to gold with central banks purchasing a record 289 tonnes of gold in the second quarter which is up 62% year-on-year, led by Poland taking its H1 total to 82 tonnes by adding 51, and China adding 33 tonnes, its largest quarterly addition since Q4 2023 taking reported holdings to 2,346 tonnes. That's central banks purchasing large quantities of gold into a market that had just fallen over 11%, an insightful signal.
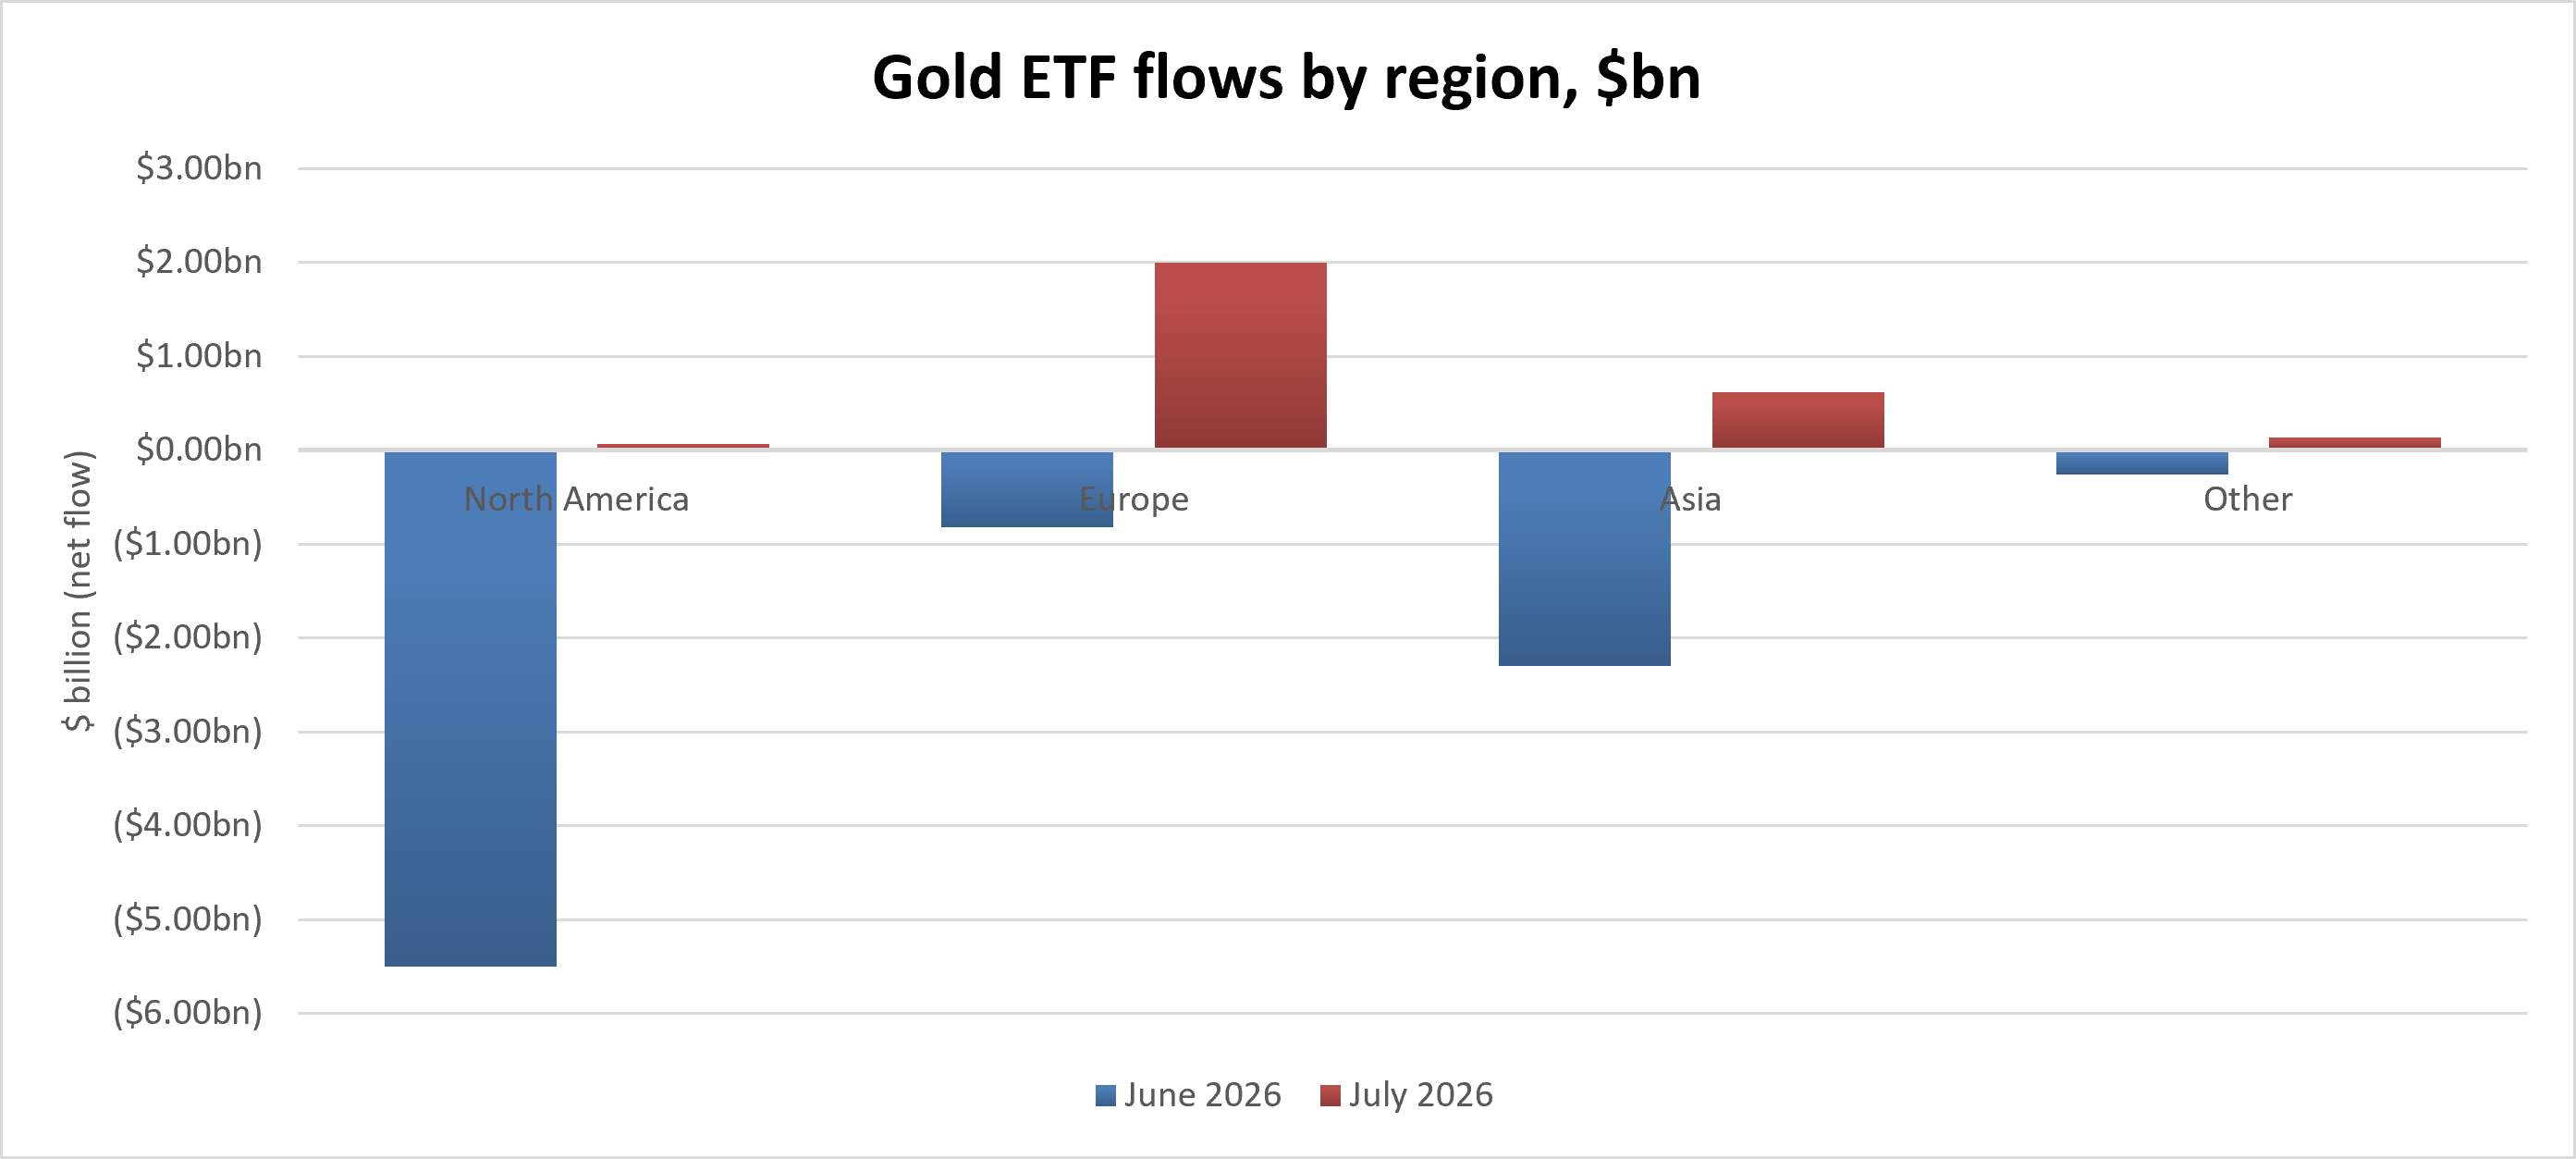
Global gold ETFs reversed two months of outflows with $3bn being added in July and lifting collective holdings to 4,068 tonnes according to the World Gold Council, led by Europe adding $2bn, the second strongest monthly inflow of the year. On the futures side of things, COMEX net longs actually eased 4.4% over the month to 542 tonnes, a reminder that July's price recovery happened despite aggregate future positioning and was driven more by ETFs and central bank gold buying.
What was moving silver?
Silver spent July doing what it usually does: amplifying gold's moves, in both directions, but with extra volatility layered on top from its own industrial-demand dynamics. It fell alongside gold in the first half of the month, dipping toward the high $50s, then rallied into the ceasefire-driven, Fed-relief rebound in the back half, briefly pushing above $60 before settling at $59.10. The persistent theme through the month was the gold/silver ratio pushing above 69 — a level some analysts read as a genuine market anomaly given silver's structural backdrop remains, if anything, more supportive than gold's: this is now silver's sixth consecutive annual supply deficit, roughly 70% of mined output comes as a byproduct of basemetal mining (meaning higher prices don't straightforwardly summon more supply the way they would for, say, a gold mine expansion), and demand from solar photovoltaics and EVs continues to grow structurally even as year-to-year growth rates in that demand fluctuate. Silver-backed ETF flow data through July showed the beginnings of a stabilisation after a rough patch — five-day and one-month flows had turned modestly positive by mid-month even though three- and six-month flows remained negative — consistent with a market that had been heavily de-risked in June starting, tentatively, to see money return. Demand and supply, in more detail: as with June, central bank purchases remain a non-factor for silver specifically -- that's a gold-only phenomenon in the official sector, worth stating plainly rather than leaving readers to wonder why silver's central-bank paragraph is always shorter than gold's. The more relevant thread for silver in July was the same broad risk-sentiment shift driving gold's ETF rebound (a mid-month tech-equity correction reportedly encouraged some investors to diversify into precious metals generally) layered on top of an unchanged structural deficit story -- the Silver Institute's 46.3- million-ounce forecast 2026 shortfall didn't move in July, and with roughly 59-61% of total silver demand coming from industrial uses (solar, EVs, electronics) rather than investment, the metal's fundamentals are considerably less exposed to any single month's ETF flow data than gold's are. Worth flagging for transparency: there is no equivalent monthly Silver Institute report to confirm precise ETF tonnage figures the way the World Gold Council does for gold, so silver's investment-demand picture each month is necessarily read more qualitatively than gold's.
What is there to look out for next month?
Heading into August, the single biggest known event is the confirmed Autumn Budget date of 28 October — not directly a precious metals catalyst, but relevant to the broader UK fiscal and sterling backdrop that feeds into GBP-priced gold and silver returns. More immediately, watch the Fed's September meeting and any further US data that could move rate-cut/hike odds again, and keep a close eye on the Middle East ceasefire's durability — the same conflict that whipsawed gold twice in July (once easing it, once igniting it) hasn't gone away, it's just paused. On the structural side, the World Gold Council's next monthly-level central bank data (expected with a lag, likely September) will show whether July itself continued the record pace of Q2 buying, or whether the 289-tonne quarterly figure was front-loaded into April and May.
My outlook
As you'll recall from last edition, my hypothesis is that gold and silver are both undervalued at current levels, and silver especially so, on the basis of a stretched gold/silver ratio, silver's ongoing structural supply deficit, and central bank gold demand running at roughly double its pre-2022 pace for four consecutive years. Is that hypothesis still in line with what July delivered? On balance, yes — arguably more so. The ratio didn't correct in July; it actually pushed to a fresh quarterly high of 69.48, meaning the "silver is cheap relative to gold" argument got stronger, not weaker, even as both metals recovered in dollar terms. The central bank buying pillar of the thesis was emphatically reinforced by the Q2 WGC data — a record quarter, with Poland and China both accelerating rather than pausing. And the supplyside story for silver hasn't changed: deficits don't resolve in a single quarter, and the byproduct-mining structure of silver supply means higher prices in July don't translate into meaningfully more silver reaching the market any time soon. If I'm being self-critical, the one thing that gives me pause is that the ratio's persistence at these elevated levels for two consecutive months now raises the question of whether "stretched versus history" is still the right frame, or whether something structural has shifted in how the market prices the two metals relative to each other — perhaps reflecting genuinely elevated safe-haven demand for gold specifically, given the concentration of this year's rally in central-bank and institutional buying rather than retail silver demand. I don't think that fully explains a 69x ratio, but it's a live risk to the thesis worth tracking rather than dismissing.
Final comments
July was a recovery month that didn't fully recover — gold and silver both ended higher, but the gold/silver ratio hit a fresh high, meaning silver still lagged on a relative basis even in a "good" month. A volatile mid-month dip gave way to a late-month rally on Fed relief and a Middle East de-escalation, while record central bank gold buying in Q2 reinforced the structural bull case. My hypothesis from last edition — that both metals, and silver in particular, remain undervalued — held up through July's data, even if the persistence of an elevated ratio is worth watching closely into August.
Sources
Bank of England July 2026 Monetary Policy Summary and Minutes
Silver Institute 2026 deficit forecast
World Gold Council Gold Demand Trends Q2 2026
World Gold Council Gold ETF Flows: June 2026